
FinTech · Stakeholder Strategy · Business Analysis
FinTech Strategy — Bridging the Business & Technical Divide
Transforming a failing payment app project by creating visual alignment between Dutch business teams and Indian development teams.
Transforming a failing payment app project by creating visual alignment between Dutch business teams and Indian development teams.
A critical payment app project at a leading Dutch insurance firm was on the verge of failure. Business stakeholders in the Netherlands and the technical team in India were interpreting text-based requirements differently.
Causing constant rework, missed deadlines, and escalating tensions between international teams.

I was responsible for ensuring clear requirements and successful project delivery. When I diagnosed that dense, 100-page documents were creating more confusion than clarity, I knew we needed a fundamentally different approach to communication.
Through stakeholder interviews and project analysis, I discovered that both teams were highly capable but were essentially speaking different professional languages. Cultural and functional divides were turning detailed requirements into sources of ambiguity rather than clarity.

I led the initiative to map the entire end-to-end payment system visually. This comprehensive diagram connected every user action to its corresponding back-end process, database entry, and API call. The visual map replaced fragmented 100-page text documents with one definitive reference both teams could trust.
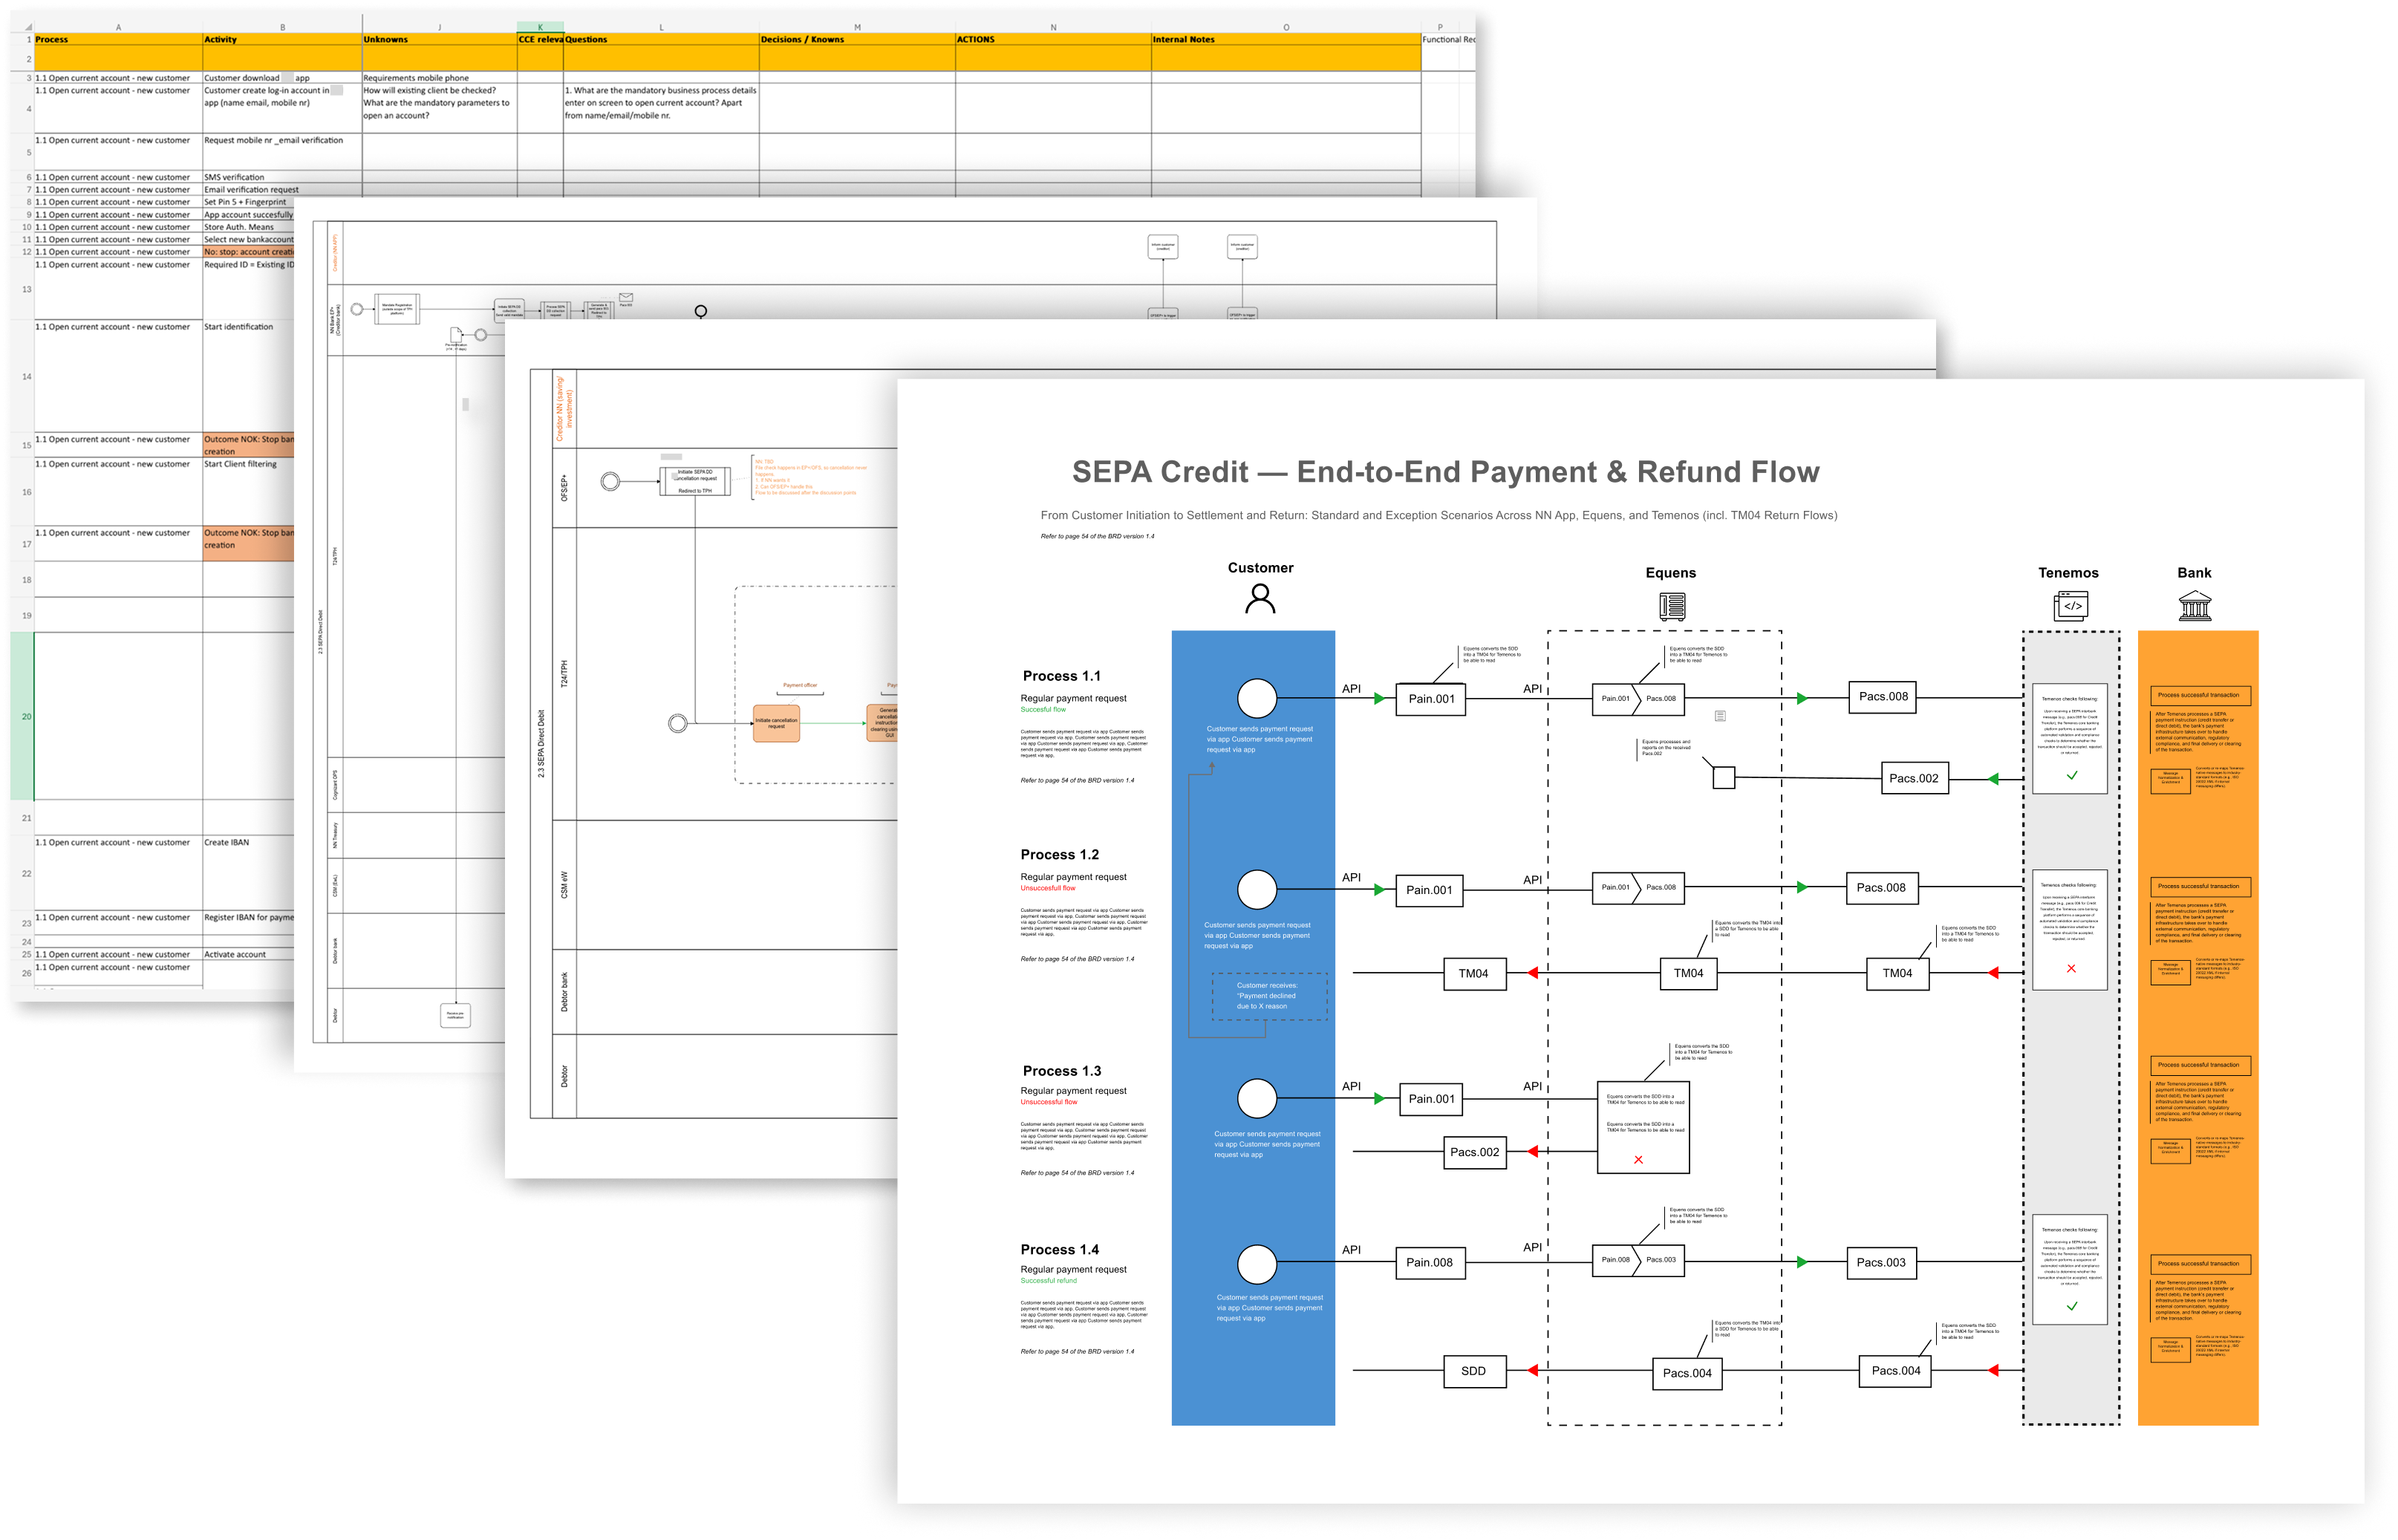
The visual map became the foundation of all project discussions. Instead of debating text interpretations, teams could point to specific diagram elements and ask "Is this correct?" This transformed meetings from frustrating miscommunication sessions into productive collaboration.

The visual process map delivered immediate, measurable results that saved the project — and received direct commendation from client leadership for the breakthrough solution.